- Introduction
In software engineering, profiling is a technique used to analyze applications at run-time, in order to identify possible bottlenecks and performance issues within an application. It is an essential resource for software optimization. Profiling differs from benchmarking because it analyzes the application at code level, while benchmarking is intended to analyze the overall application performance as experienced by the end user.A profiler is a software that will gather detailed information about the application in order to generate statistics and insightful data about memory usage, frequency and duration of function calls, time to respond to a request, amongst other things.XHProf is a profiler designed to analyze PHP applications. Created and open sourced by Facebook, XHProf works as a passive profiler, which means it will work in the background while having minimum impact on the application’s performance, making it suitable to be used on production environments.
(copy from digital ocean) - How to install xhprof
Update the package manager cache withsudo apt-get updateNext, we’ll install
peclwith thephp-pearpackage. We’ll also needphp5-devin order to install PHP modules viapecl
sudo apt-get install php-pear php5-dev
sudo pecl install xhprof-betaEdit php.ini file to enable your xhprof extension. Look like the below,
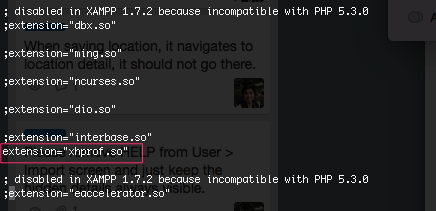
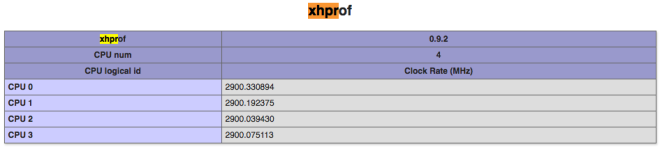
Restart your php daemon, open your phpinfo to make sure xhprof extension is loaded properly,
- How to configure in Yii 1.x application
Download Yii-xhprof and put into protected/extensions, you will see something like below,

Make sure this config is in your application configuration,'preload' => array( 'xhprof' ),
and
 'components' => array(
    'xhprof' => array(
        'class' => 'ext.yii-xhprof.XHProfComponent',
        'libPath' => '/full/path/to/xhprof_lib',
        'htmlReportBaseUrl' => 'http://url.path.to/xhprof_html',
 ),),
- How to view the result
Download PHP view and library package here, extract and copy these into your proper place, mine is in the root of application,

In the xhprof configuration above, configure the libPath point to xhprof_lib folder
Add virtual host point to xhprof_html in order to view the result. You can use apache or nginx,
Yah, all will be done, you should see something like this
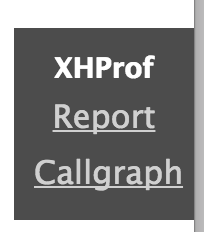
You can click on Report link to see all the calls - How to generate callgraph
Click on Callgraph for visualization view, you can see all methods’ calls graphically like below
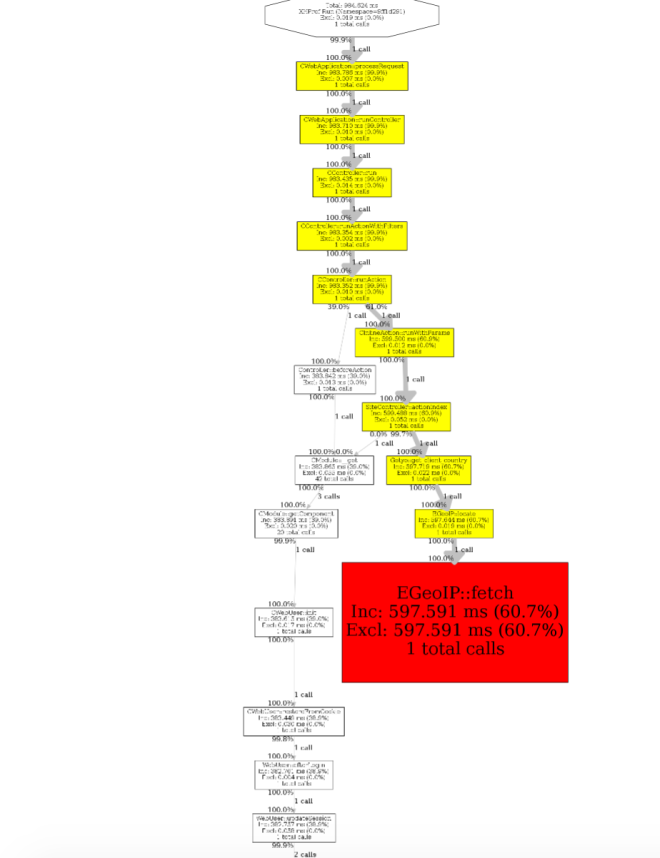
Make sure graphziz is installed on your system, if not you may encounter this problemfailed to execute cmd: " dot -Tpng". stderr: `sh: 1: dot: not found 'Install graphziz as the command below
sudo apt-get install graphviz
